Discount Spend Optimization
At a glance
| In short | A modelling pipeline for an FMCG company that shows where trade discounts actually lift sales, and what happens to sales and profit if they change. |
|---|---|
| Problem | Discount budgets are spread across states, packs and channels, and it is hard to see which ones pay back. |
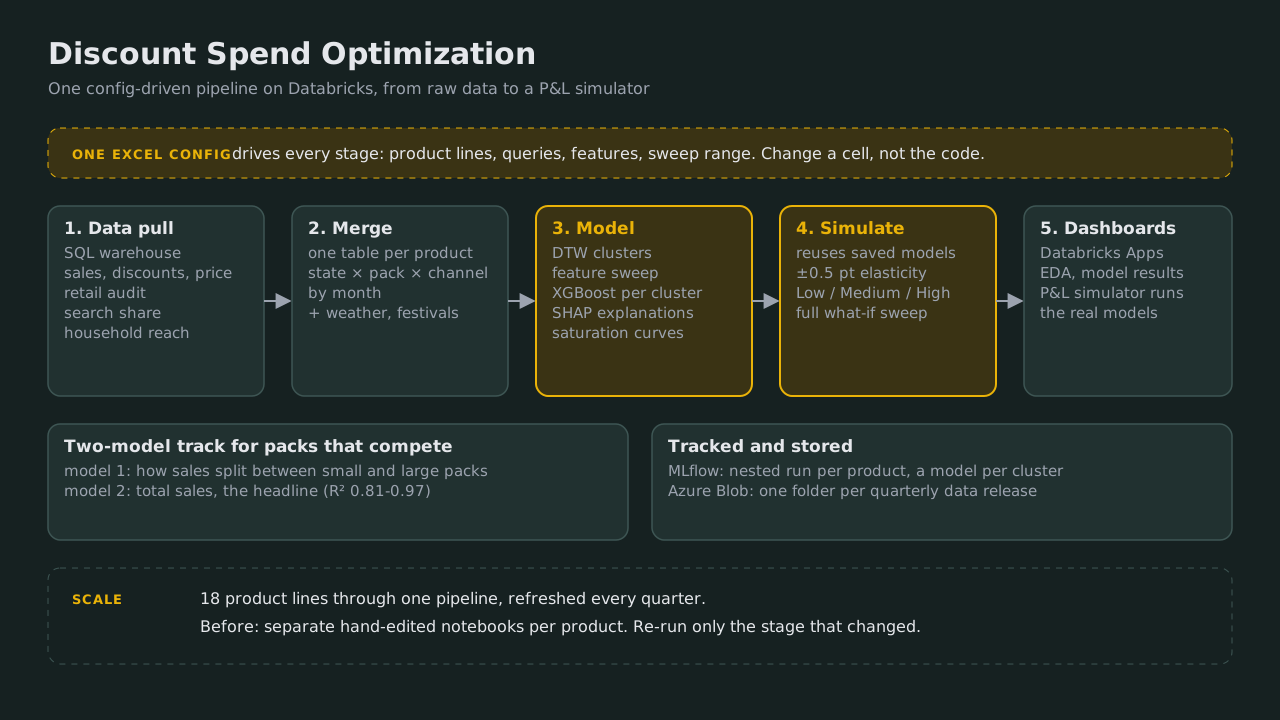
| What I built | One config-driven pipeline on Databricks for 18 product lines: data pull, merge, models, simulation and two dashboards. |
| How it works | Group segments with similar sales patterns, train one model per group, then change only the discount and re-predict to measure the effect. |
| Result | Separate hand-edited notebooks per product became one pipeline that runs for any product from an Excel config. Headline models reach R² 0.81-0.97; mature products 11-22% wMAPE. |
| Tech | Python, pandas, DTW clustering, XGBoost, SHAP, MLflow, Databricks notebooks and Apps, Azure Blob, Streamlit |
Flow
- Excel configdrives every stage
- Data pullwarehouse SQL
- Mergestate × pack × channel
- Cluster + modelDTW, XGBoost, SHAP
- Simulateelasticity, saturation
- DashboardsP&L simulator
Key points
- One Excel workbook drives every stage: change a cell, not the code
- Elasticity: predict sales at today's discount and ±0.5 points, then rate each segment Low, Medium or High
- Saturation curves show where extra discount stops paying
- Packs that take sales from each other get two models: one for the split, one for total sales
- The P&L simulator loads the real models, so its numbers match the notebooks exactly
- Every run is tracked in MLflow, with a model registered per cluster
Results
| Bucket | Elasticity | What it means |
|---|---|---|
| Low | < 0.05 | discount barely moves sales |
| Medium | 0.05 - 0.5 | some response, watch it |
| High | ≥ 0.5 | strong response, worth funding |
| Stage | Output |
|---|---|
| 1. Data pull | one file per product per source |
| 2. Merge | one model-ready table per product |
| 3. Model | clusters, models, SHAP, saturation curves |
| 4. Simulate | elasticity report and full what-if sweep |
| 5. Dashboards | model results and P&L simulator |
Architecture
Technical details
- Inputs: sales, discounts and price from the warehouse, retail audit, search share, household penetration, weather and a festival calendar
- Segments are State × Pack × Channel by month, filled to continuous months so gaps do not distort the models
- Features are picked per cluster by sweeping combinations; discount is always kept
- The what-if sweep covers the 5th to 95th percentile of past discount in 0.1-point steps
- Outputs are stored in Azure Blob by quarterly release, so only the stage that changed needs a re-run
- Model quality is tracked per cluster with r², MAPE and wMAPE
- The first version ran locally in pure pandas with Streamlit dashboards on Hugging Face Spaces
- discount optimization
- trade promotion
- price elasticity
- marketing mix modelling
- time series clustering
- DTW
- XGBoost
- SHAP
- MLflow
- Databricks
- FMCG analytics
The code for this project is private, so there is no public link.
All projects